plotGenotype - Show a colorful representation of a genotype
Description
plotGenotype plots a genotype table.
Usage
plotGenotype(
genotype,
facet_by = NULL,
gene_sort = c("name", "position"),
text_size = 12,
silent = FALSE,
...
)
Arguments
- genotype
data.frameof alleles denoting a genotype, as returned by inferGenotype.- facet_by
- column name in
genotypeto facet the plot by. ifNULL, then do not facet the plot. - gene_sort
- string defining the method to use when sorting alleles.
if
"name"then sort in lexicographic order. If"position"then sort by position in the locus, as determined by the final two numbers in the gene name. - text_size
- point size of the plotted text.
- silent
- if
TRUEdo not draw the plot and just return the ggplot object; ifFALSEdraw the plot. - …
- additional arguments to pass to ggplot2::theme.
Value
A ggplot object defining the plot.
Examples
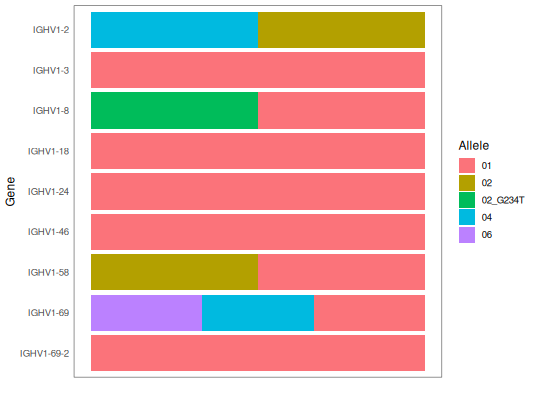
# Plot genotype
plotGenotype(SampleGenotype)
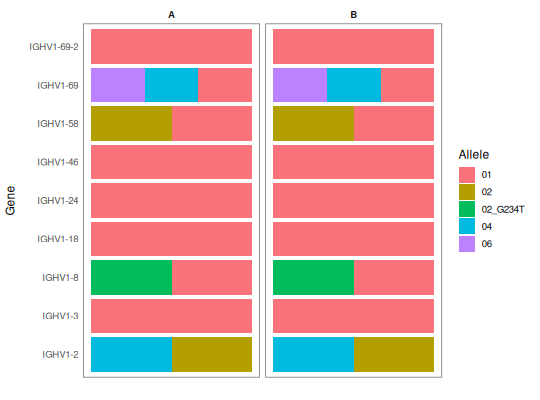
# Facet by subject
genotype_a <- genotype_b <- SampleGenotype
genotype_a$SUBJECT <- "A"
genotype_b$SUBJECT <- "B"
geno_sub <- rbind(genotype_a, genotype_b)
plotGenotype(geno_sub, facet_by="SUBJECT", gene_sort="pos")