plotNovel - Visualize evidence of novel V alleles
Description
plotNovel is be used to visualize the evidence of any novel V
alleles found using findNovelAlleles. It can also be used to
visualize the results for alleles that did
Usage
plotNovel(
data,
novel_row,
v_call = "v_call",
j_call = "j_call",
seq = "sequence_alignment",
junction = "junction",
junction_length = "junction_length",
pos_range_max = NULL,
ncol = 1,
multiplot = TRUE
)
Arguments
- data
data.framecontaining repertoire data. See findNovelAlleles for details.- novel_row
- single row from a data frame as output by findNovelAlleles that contains a polymorphism-containing germline allele.
- v_call
- name of the column in
datawith V allele calls. Default isv_call. - j_call
- name of the column in
datawith J allele calls. Default isj_call. - seq
- name of the column in
datawith the aligned, IMGT-numbered, V(D)J nucleotide sequence. Default issequence_alignment. - junction
- Junction region nucleotide sequence, which includes
the CDR3 and the two flanking conserved codons. Default
is
junction. - junction_length
- number of junction nucleotides in the junction sequence.
Default is
junction_length. - pos_range_max
- Name of the column in
datawith the ending positions of the V alignment in the germline (usuallyv_germline_end). - ncol
- number of columns to use when laying out the plots.
- multiplot
- whether to return one single plot (
TRUE) or a list with the three individual plots (FALSE).
Details
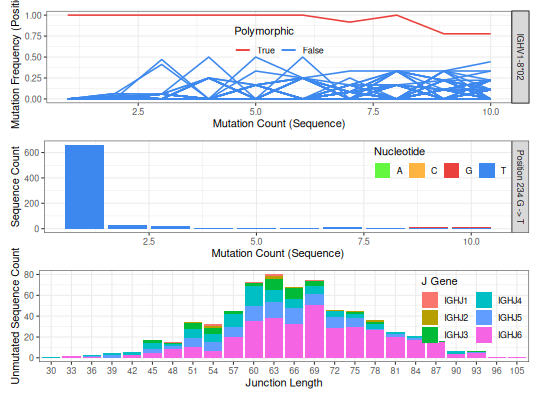
The first panel in the plot shows, for all sequences which align to a particular germline allele, the mutation frequency at each postion along the aligned sequence as a function of the sequence-wide mutation count. Each line is a position. Positions that contain polymorphisms (rather than somatic hypermutations) will exhibit a high apparent mutation frequency for a range of sequence-wide mutation counts. The positions are color coded as follows:
- red: the position(s) pass(ess) the novel allele test
- yellow: the position(s) pass(ess) the y-intercept test but not other tests
- blue: the position(s) didn’t pass the y-intercept test and was(were) not further considered
The second panel shows the nucleotide usage at each of the polymorphic positions as a function of sequence-wide mutation count. If no polymorphisms were identified, the panel will show the mutation count.
To avoid cases where a clonal expansion might lead to a false positive, TIgGER examines the combinations of J gene and junction length among sequences which perfectly match the proposed germline allele. Clonally related sequences usually share the same V gene, J gene and junction length. Requiring the novel allele to be found in different combinations of J gene and junction lengths is a proxy for requiring it to be found in different clonal lineages.
Examples
# Plot the evidence for the first (and only) novel allele in the example data
novel <- selectNovel(SampleNovel)
plotNovel(AIRRDb, novel[1, ], v_call="v_call", j_call="j_call",
seq="sequence_alignment", junction="junction", junction_length="junction_length",
multiplot=TRUE)